 Top Lists for USA
How To Trade On Plus500 For Beginners
I’ve spent countless hours using the Plus500 platform, placing trades on forex pairs, US stocks, precious metals, energies, and major equity indices. If you’re new to the platform, here’s how to trade on Plus500 in simple steps.
 Written By
James Barra
James is an experienced broker analyst with a background in financial services. He has spent 2,500+ hours testing brokers, used 35+ different platforms and apps, audited 120+ broker T&Cs, and verified 300+ regulatory licenses. James has also been on US and UK TV, and been a guest on finance podcasts, discussing reports conducted by BrokerListings.com and sharing his expertise.
James Barra Profile Page Fact Checked By
Tobias Robinson
Tobias is committed to helping traders find the right brokerage for their needs. He has tested 200+ brokers, spent 2,600+ hours using different platforms, and placed 2,100+ trades.
Tobias Robinson Profile Page Edited By
William Berg
William Berg combines his expertise in law and finance to analyze trading brokers. He has checked 3,250+ regulatory licenses, investigated 2,365+ broker clones and trading scams, and placed 3,500+ trades.
William Berg Profile PageOctober 7, 2026
Step 1 – Load The Platform
The first thing to do is open the web-based platform. Once you log in, select the ‘Trade’ button in the left-hand menu. This will bring up the view below.
You’ll realise it has a distinct design as it’s a proprietary platform, so it will feel different to third-party software like TradingView, MT5 or cTrader, but most of the nuts and bolts are similar.
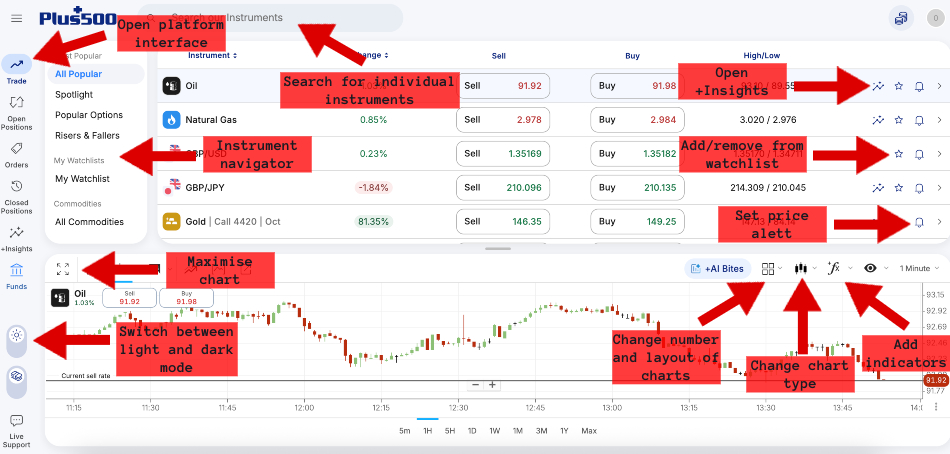
There are three key panels:
- Instrument navigation: You can browse by Plus500’s curated lists, such as ‘Risers & Fallers’ which may appeal to beginner traders, your own watchlists (I explain how to build these later), or asset class (there’s over 2,800 assets split across commodities, indices, 24/5 trading, shares by various countries, forex, and ETFs). Alternatively, you can use the ‘search our instruments’ bar. Since I know what I intend to trade, I use this the most.
- Instrument overview: This shows key details for the asset or assets selected, including buy and sell price, and the percentage change and high/low for that day. The buttons to the right of the respective asset let you open +Insights (I unpack this feature later), add the asset to a watchlist, or set up price alerts.
- Charts: There’s a panel at the bottom with a price chart, which you can maximize to the screen by clicking the button in the top left. The charting package is excellent – you get 14 chart types plus 6 aggregated chart types, 13 timeframes from tick to 1 month (catering to short-term traders), and over 115 technical indicators (if you’re a beginner, clicking the ‘common indicators’ button gives you the key ones, e.g. Bollinger Bands and MACD).
In the vertical menu panel to the left, you can also click to view ‘Open Positions’, ‘Orders’, ‘Closed Positions’, ‘+Insights’, and ‘Funds’ to manage deposits and withdrawals. There’s also the option to change between light and dark mode. I prefer light as it’s clean and simple, but this is a personal preference.
One gripe on customization – the Plus500 platform doesn’t allow for extensive tailoring of the dashboard. Most annoyingly, you can’t drag to widen the panels – you can just make them bigger or smaller by stretching them vertically. I’d like to keep the central ‘Instrument’ panel but keep it a small box to the right, but I can’t really do that – it’s either thing taking up a wide portion of the screen, or I maximize the chart, and it’s gone completely. It’s only minor, but it’s ground on me after many trading sessions.
Step 2 – Set Up A Trade
Once you’ve used the instrument panel or search bar to bring up the asset that you’re interested in, you can use the price chart to run any analysis in line with your trading strategy. The extensive charting package and tools lend the Plus500 platform to various active trading strategies, including day and swing trading, though keep in mind scalping is not permitted.
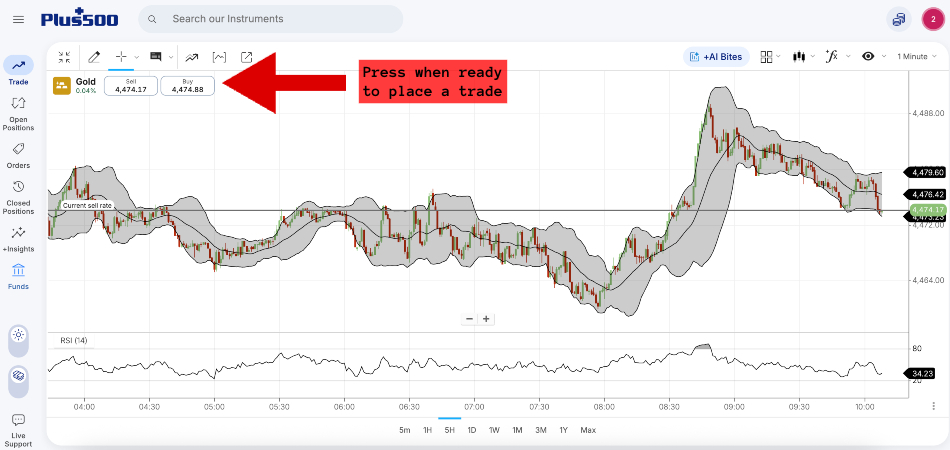
This is where I maximise the charting screen for ease. You can see below that I analyzed gold using a candlestick chart, with the candlestick timeframe set to 1 minute because I was interested in short-term price movement, and overlaid Bollinger Bands and the RSI.
In this situation, there wasn’t a clean entry yet. The chart was slanting bearish, but I needed to wait for confirmation:
- I was looking to go short if there was a decisive break below 4,472-4,473, followed by a failed retest.
- I was looking to go long if 4,472-4,474 were to hold, RSI picked up after near-oversold territory, and price reclaimed to around 4,476.5.
Gold chart
For traders running setups across multiple assets, the four squares button on the right also lets you open multiple charts simultaneously, up to 25, though I’ve done this and you can barely see new candles emerge or price action unless you have a very large monitor, so I doubt most new traders will need it.
Step 3 – Place A Trade
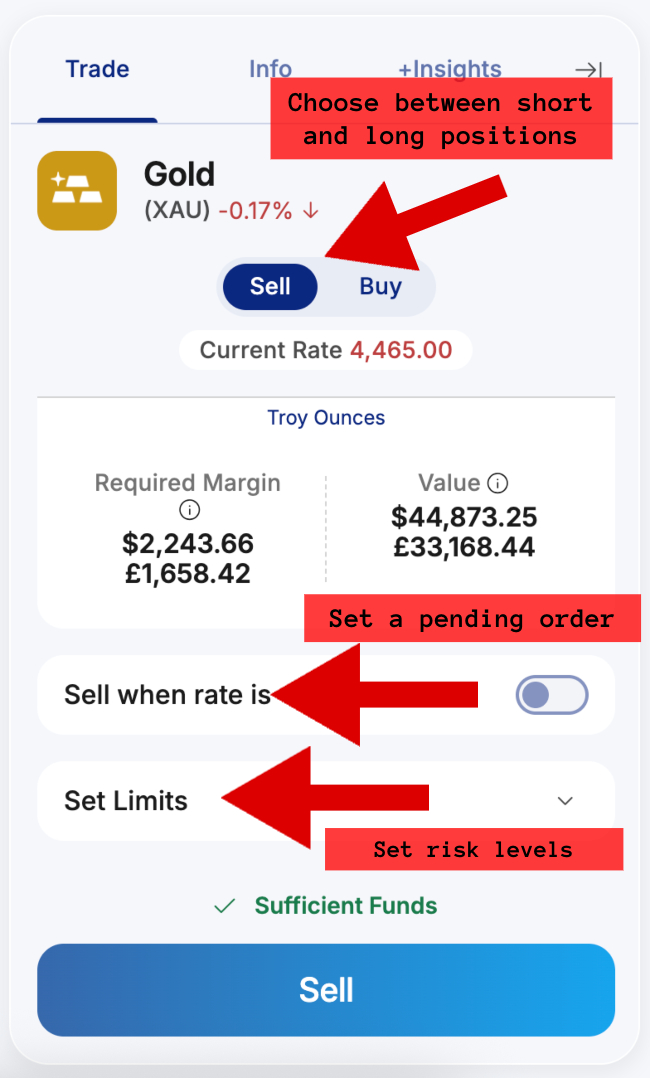
When you’re ready, you can place a trade by pressing the ‘Sell’ or ‘Buy’ buttons you can see in the top left of the charting platform, and which are annotated in the screenshot above. This opens up the order panel on the right, where you can configure the positions and risk management settings. For example, for a short position, you see the below. For a long position, you see similar settings.
- Switch between sell/buy: Choose sell if you believe the price will fall and buy if you expect it to rise.
- Enter the trade size: This sets your trade exposure. How this is denominated depends on the asset, e.g. it’s troy ounces for gold, but lots for forex, and number of shares for equities.
- Sell when rate is: This is a pending order that says don’t open the trade until price hits the level entered.
- Set limits to control risk (opens a dropdown menu where you can enter or toggle prices):
- Close at profit: This tells Plus500 to automatically close the trade to lock in a profit at the entered level.
- Close at loss: This tells Plus500 to automatically close the trade to limit a loss at the entered level.
- Trailing stop: This tells Plus500 to automatically close the trade to limit losses if price rallies against your short position. Its trailing because it moves in tandem with the market.
You confirm the trade by hitting the big blue Sell/Buy button at the bottom of the order panel.
Order configuration
Step 4 – Manage And Close Trade
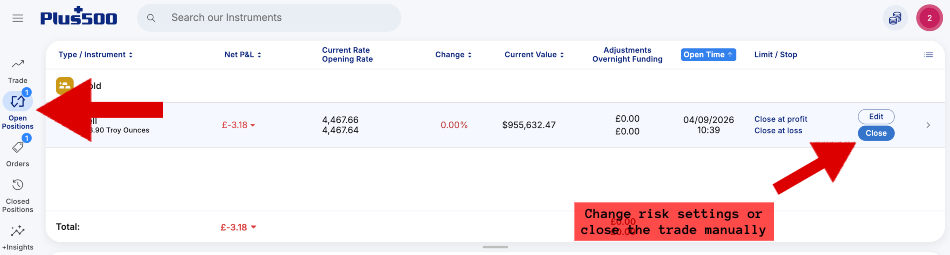
Once the trade is open, either through immediate execution or a pending order, you can see its current status by selecting ‘Open Positions’ on the left of the platform interface.
From here, you can also change or add risk limits by pressing ‘Edit’ which opens a sidebar with access to ‘close at profit’, ‘close at loss’, and ‘trailing stop’. Alternatively, you can press ‘Close’ to exit the position manually at the current price and profit/loss.
Order management
When the trade is closed, your account balance will automatically be debited or credited with the result. You can also view the trade details by clicking ‘Closed Positions’ in the left menu panel. As you can see below, it shows your Net P&L, closed price, any overnight fees, times, and other key details.
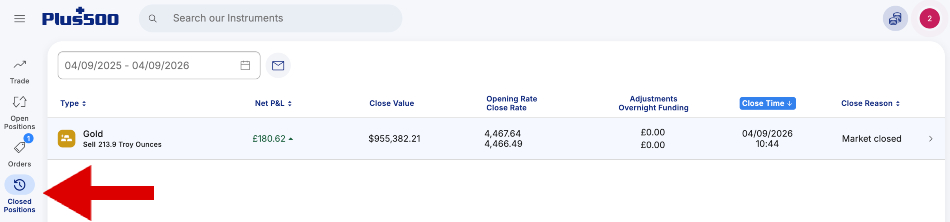
Closed orders
Tips For Beginners
For beginner traders and those new to the Plus500 platform, there are five valuable extras worth exploring:
- Setting up watchlists: This makes tracking assets much easier if you’re interested in US technology stocks or GBP currency pairs, for example. Simply click the star icon next to an asset, and then you can choose to add it to your generic watchlist, or you can create a new one, e.g. ‘US tech stocks’.
- Setting up price alerts: This brings your attention to assets when prices hit set levels where you may want to then make a trade or take another action. Hit the bell icon next to an asset to configure the alert. You can set an alert based on price, daily percentage change, or current sentiment amongst Plus500’s clients – a setting most platforms don’t offer. I’ve set them up, and they’re easy to configure and can be delivered by SMS, email, and push notifications in the Plus500 platform itself.
- Using +Insights: Get information on the activity of Plus500’s 30+ million users in real-time, including the most traded assets, the most profit-making and most loss-making positions, the most viewed assets, and the highest buy and sell ratios. You can filter by time period, see how many users the data is based on, and view it based on global users or local to your country. It’s interesting data that the vast majority of brokers do not offer. Click the ‘+Insights’ button in the left panel to open.
- +AI Bites: Get instant, AI-powered insights into the asset on your chart. You can get technical analysis, a summary of recent news, and platform sentiment synthesized for the asset in question. It’s a neat addition that I used sometimes to get a quick answer on e.g. social sentiment rather than digging through the +Insights panel. I wouldn’t base my trading decisions on its AI, but it’s useful for getting surrounding context on an instrument before placing a trade.
- Guaranteed stop loss order (GSLO): Plus500 is one of the top brokers offering a guaranteed stop loss order, allowing you to lock in a set price regardless of market volatility. It offers price certainty in choppy markets in return for a wider spread that the platform shows you before you confirm. Click ‘Set limits’, then ‘Close at loss’ and tick the ‘Guaranteed stop’ box to use it.
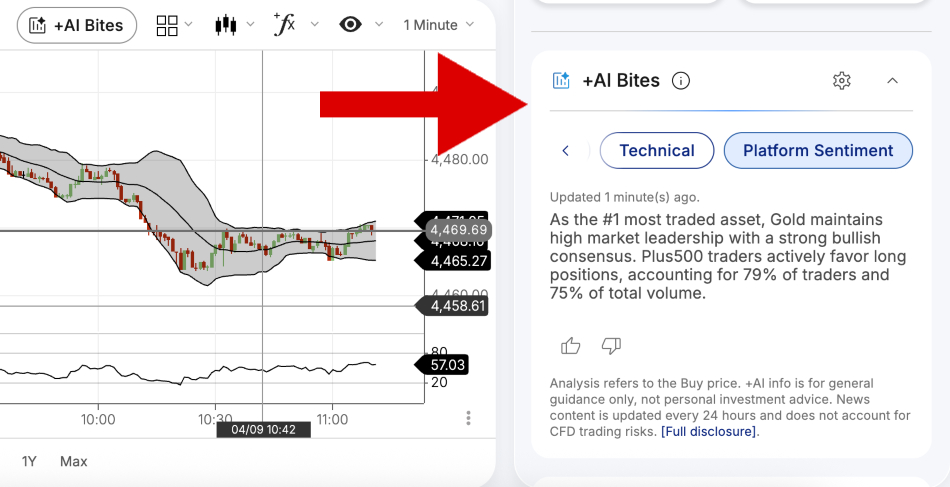
+AI Bites