

Reddit vs Reality: Does WallStreetBets Still Move Markets?
We tracked every daily leaderboard on r/WallStreetBets for a full trading week. That meant 135 leaderboard entries, 45 sentiment readings, and 2,847 comment votes, all matched against official price data. The short answer: WallStreetBets doesn’t move markets anymore. It reacts to them, gets louder when things go badly, and its trading calls are wrong more often than right.
 Written By
Christian Harris
Christian is a seasoned analyst, leveraging his expertise in stocks, forex, and crypto to evaluate brokers worldwide. With hands-on trading experience and a strong focus on risk management, he helps traders find reliable platforms. Christian's work for BrokerListings.com has been cited in the Financial Times.
Christian Harris Profile Page Fact Checked By
Tobias Robinson
Tobias is committed to helping traders find the right brokerage for their needs. He has tested 200+ brokers, spent 2,600+ hours using different platforms, and placed 2,100+ trades.
Tobias Robinson Profile Page Edited By
James Barra
James is an experienced broker analyst with a background in financial services. He has spent 2,500+ hours testing brokers, used 35+ different platforms and apps, audited 120+ broker T&Cs, and verified 300+ regulatory licenses. James has also been on US and UK TV, and been a guest on finance podcasts, discussing reports conducted by BrokerListings.com and sharing his expertise.
James Barra Profile PageJuly 27, 2026
Back in January 2021, millions of retail traders pushed GameStop from under $20 to an intraday high of $483, hurting hedge funds and forcing brokerages to freeze buying. Five years later, there’s little evidence about what comes next. Many tools track what WallStreetBets is saying, but almost no one checks if those words actually lead to anything.
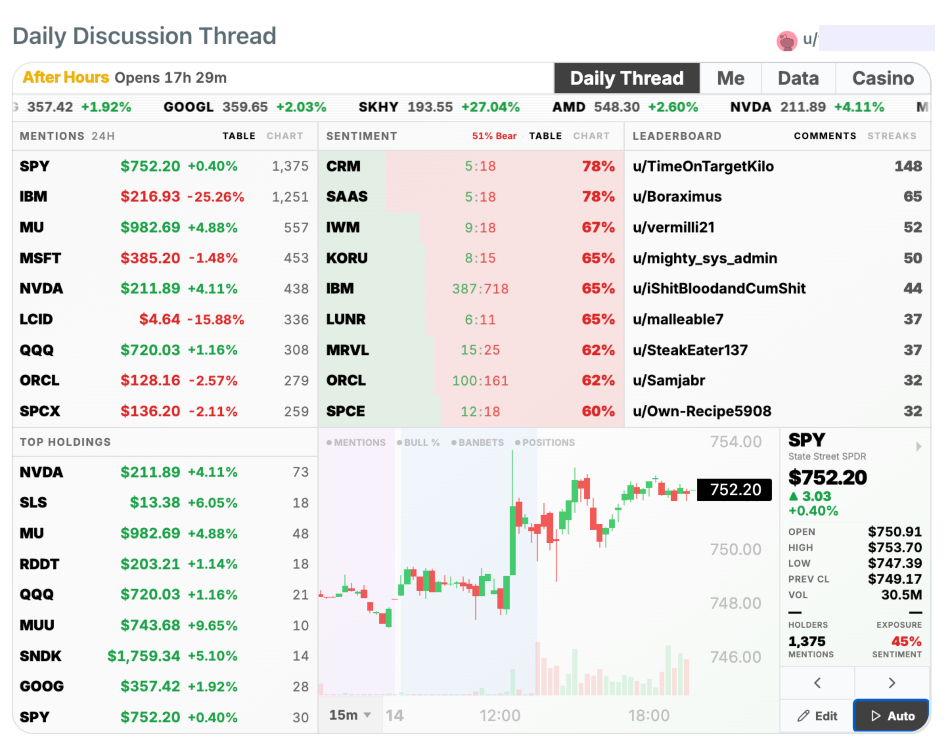
So we ran our own test. For one week in July 2026, we collected all three leaderboards from the community tracker: most-mentioned tickers, bull or bear sentiment, and self-reported holdings. Then we compared these to what actually happened in the market afterward.
The results surprised us. The prediction test everyone wants showed no advantage at all – just 41.7%, which is slightly worse than a coin toss. What we found instead was a picture of a crowd that has changed a lot since 2021.
Key Findings
- There’s no advantage in the crowd’s predictions. Out of twelve calls we could score, five were right and seven were wrong, for a 41.7% success rate. Bullish calls were correct 3 out of 9 times, and bearish calls 2 out of 3. Put another way, once you remove price moves that had already happened, WallStreetBets stock predictions were wrong nearly 60% of the time.
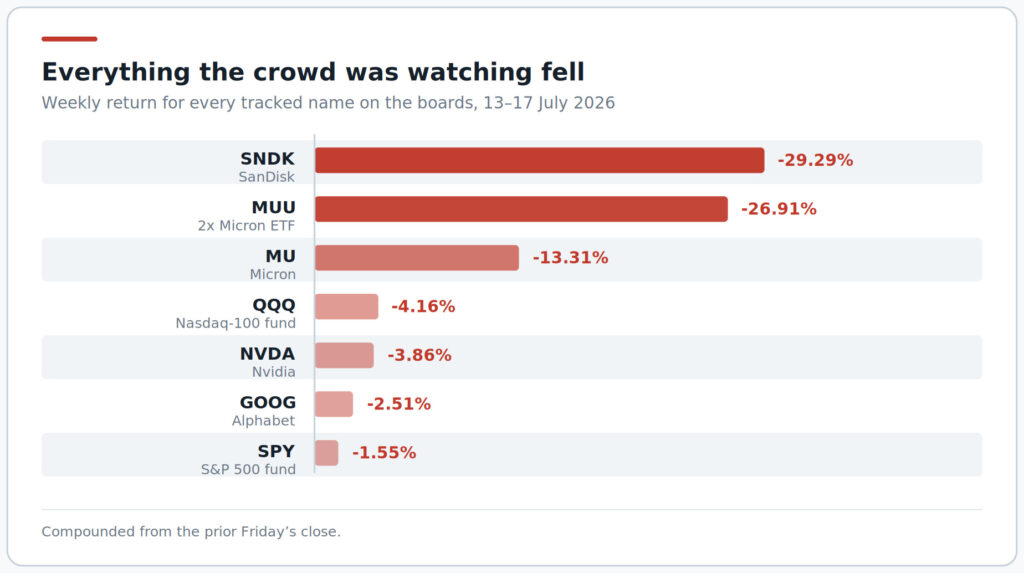
- They bought the dip, and the dip kept dipping. Micron holders rose from 49 to 52 while the stock fell 13.3%. SanDisk holders rose from 14 to 16 while it fell 29.3%. Put simply, members steadily increased their stock holdings all week precisely as those same stocks plunged up to 29% in value.
- Opinions change quickly, but positions stay put. The sentiment leaderboard changed by 89% each day, while the holdings list changed by only 19%. No stock stayed in the top nine for sentiment all week. So traders may swap their daily convictions, but they still hold onto the same core investments day after day.
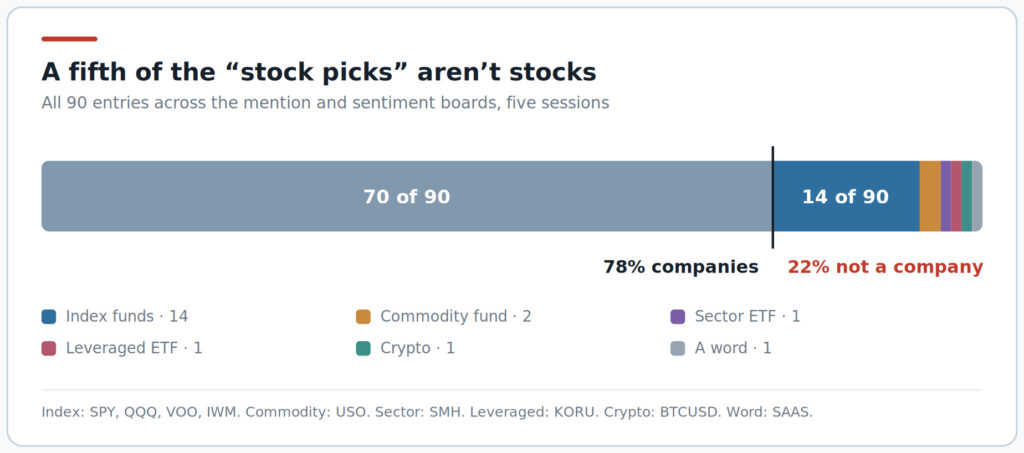
- More than a fifth of what WallStreetBets “picks” isn’t a company. Of the 90 leaderboard entries, 20 (22%) were index funds, commodity funds, leveraged ETFs, crypto, or cash. Essentially, WSB has outgrown its roots which focused on individual stocks.
- Attention goes up when the market goes down. SPY mentions had a −0.80 correlation with SPY’s daily return for the week, and a +0.90 correlation with SPY’s share volume. The crowd was 30% louder on days when the market fell than on days when it rose, suggesting the crowd reacts to active sell-offs rather than starting new rallies.
Methodology
We used data from the tracker in the r/wallstreetbets Daily Discussion Thread, which is the dashboard the community follows during each session. It publishes three separate leaderboards, and keeping them separate was our most important methodological choice.
On the first day, the most-mentioned list (SPY, MU, MSFT) and the strongest-sentiment list (GME, AAOI, JPM) shared only one ticker. These aren’t just columns in a table – they represent three different groups. Combining them, as someone might do at first, doesn’t make sense.
We graded each directional sentiment call based only on direction: it was correct if a bullish call was followed by a positive next-day return, or a bearish call by a negative one. We used the simplest test possible so the results couldn’t be accused of being manipulated by setting thresholds. We also note in the results where a noise filter would change things.
Three filters were applied before anything was scored:
- A 40-comment floor. Most sentiment readings ride on tiny samples. GameStop’s 82% bullish score on 13 July came from 22 comments. Anything under 40 was logged and set aside.
- Funds were separated from companies. The question is about individual stocks. SPY, QQQ, VOO, IWM, SMH (index), USO (commodity), GBIL (cash), MUU, KORU (leveraged), and BTC/USD (crypto) were tagged and excluded from stock-level scoring. The specific tickers rotate daily, so we classified by type rather than using a fixed blocklist.
- We focused on prediction, not movement. A daily snapshot can’t prove what causes what. We tested whether the crowd’s opinion came before the next session’s direction.
Finding 1: The Crowd’s Directional Read Has No Edge
We set out to score whether sentiment predicts direction. Here is every call that survived the filters, with the official price action beside it.
« Make Full Width »| Date | Ticker | Comments | Lean | Same-day | Next-day | Change | Incl. same day | Next day only |
|---|---|---|---|---|---|---|---|---|
| 13 Jul | TSM | 44 | Bullish | −2.89% | −0.28% | −3.16% | incorrect | incorrect |
| 13 Jul | RDDT | 49 | Bullish | +2.86% | +1.16% | +4.06% | correct | correct |
| 14 Jul | IBM | 1,105 | Bearish | −25.21% | −2.70% | −27.23% | correct | correct |
| 14 Jul | MRVL | 40 | Bearish | +2.26% | −7.27% | −5.18% | correct | correct |
| 14 Jul | ORCL | 261 | Bearish | −2.74% | +3.56% | +0.72% | incorrect | incorrect |
| 15 Jul | GOOG | 82 | Bullish | +3.60% | −4.43% | −0.99% | incorrect | incorrect |
| 15 Jul | AEHR | 52 | Bullish | +21.91% | −4.09% | +16.93% | correct | incorrect |
| 15 Jul | V | 234 | Bullish | −0.25% | +2.82% | +2.56% | correct | correct |
| 15 Jul | ASML | 199 | Bullish | +2.23% | −1.67% | +0.52% | correct | incorrect |
| 16 Jul | WEN | 54 | Bullish | +5.10% | −0.89% | +4.16% | correct | incorrect |
| 16 Jul | LCID | 44 | Bullish | +8.57% | +13.93% | +23.70% | correct | correct |
| 16 Jul | MSFT | 491 | Bullish | +1.38% | −1.82% | −0.46% | incorrect | incorrect |
| 17 Jul | HOOD | 57 | Bearish | −5.72% | — | −5.72% | correct | — |
| 17 Jul | SPCE | 61 | Bearish | −1.16% | — | −1.16% | correct | — |
| 17 Jul | NFLX | 778 | Bearish | −7.26% | — | −7.26% | correct | — |
The same twelve calls, scored two ways. The gap is the value of hindsight.
Both columns score on direction alone – a bullish lean followed by a positive return is correct; a bearish lean followed by a negative return is correct. They differ only in the window measured. Incl. same day uses the compounded move across the mentioned day and the next session. Next day only uses the following session, the first one the crowd could actually have predicted. The three 17 July calls have no next-day score because the window closed.
If you score the crowd generously, counting the day they were already commenting on, WallStreetBets looks pretty good: 11 out of 15 correct, or 73.3%.
But if you only count what happened after the call, the same crowd got 5 out of 12 right, or 41.7% – a bit worse than flipping a coin.
On the identical 12 calls that have both figures, the comparison is 8-from-12 (66.7%), including the same day, versus 5-from-12 (41.7%) on the next day alone.
That 25-point gap is the most important number in this study. It shows the value of hindsight. A quarter of WallStreetBets’ apparent accuracy isn’t prediction – it’s just the crowd commenting on moves that already happened. If you remove the part they were reacting to, their edge doesn’t just disappear; it actually reverses.
Three calls flip between the two columns, and each one is the same story:
- Aehr Test Systems leaped +21.91% on 15 July. The crowd turned 75% bullish that evening. It fell 4.09% in the next session. Generous scoring calls that a win on a +16.93% two-day move; honest scoring calls it what it was — buying the spike after the spike.
- Wendy’s rose 5.10%, drew a 72% bullish reading, then slipped 0.89%.
- ASML rose 2.23%, drew 68% bullish, then fell 1.67%.
In every case, the crowd’s excitement came after the gain and before the drop. That’s the main reason behind the headline finding of this study, shown here as a number instead of just an argument.
Finding 2: They Bought The Dip, And The Dip Kept Dipping
The week’s dominant theme was AI memory hardware — and it fell in four of the five sessions.
« Make Full Width »| Ticker | Mon 13 | Tue 14 | Wed 15 | Thu 16 | Fri 17 | Week |
|---|---|---|---|---|---|---|
| MU (Micron) | −4.32% | +4.92% | −8.02% | −5.65% | −0.50% | −13.31% |
| SNDK (SanDisk) | −12.63% | +5.01% | −8.12% | −12.63% | −3.99% | −29.29% |
| MUU (2x Micron ETF) | −9.01% | +9.50% | −15.79% | −12.02% | −0.98% | −26.91% |
There was one up day and four down days. The crowd’s favorite theme of the week lost between one-seventh and almost a third of its value. The leveraged version did exactly what you’d expect, dropping almost exactly twice as much as Micron (−26.91% compared to −13.31%).
Now compare what the crowd did with its positions while that happened:
« Make Full Width »| Ticker | Holders Mon → Fri | Price move over the week |
|---|---|---|
| MU | 49 → 52 (+3) | −13.31% |
| SNDK | 14 → 16 (+2) | −29.29% |
| QQQ | 20 → 22 (+2) | −4.16% |
| NVDA | 72 → 74 (+2) | −3.86% |
| GOOG | 28 → 29 (+1) | −2.51% |
Every name we could track finished the week down. SanDisk lost nearly a third.
Every position on the board increased while every price dropped. This is the clearest pattern in the data: the crowd kept buying as prices fell. SanDisk is the most obvious example – holders went up by two while the stock lost 29% in five sessions. Whether that’s conviction or stubbornness will depend on what happens next week, but it’s definitely reactive: buying after the move, not before.
One detail about how conviction shows up in 2026: among the holdings were MUU, a 2x-leveraged Micron ETF, and GBIL, a Treasury bill fund – someone even listed ‘holding cash’ as a position. In 2021, people preferred short-dated calls. Now, they use leveraged ETFs, with cash parked right alongside them.
Finding 3: Loud Opinions, Sticky Positions
Here’s the structural discovery – day-over-day carryover in each leaderboard:
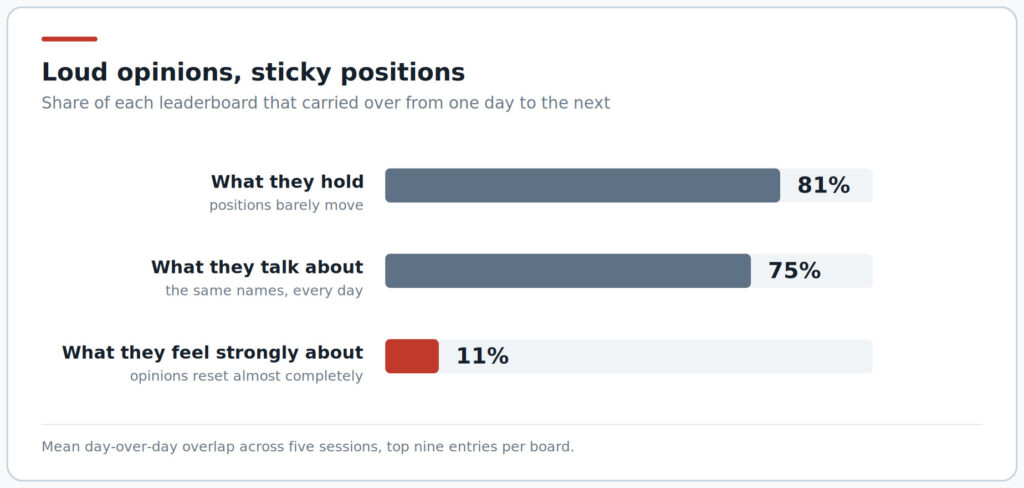
Positions and topics stick around, but strong opinions almost completely change overnight.
Six of the nine most-mentioned slots were occupied by the same six tickers every single day: SPY, MU, MSFT, NVDA, QQQ, and SPCX. Meanwhile, not a single stock held a top-nine sentiment place across all five sessions. Monday’s strongest opinions (GME, AAOI, JPM, OKLO) and Tuesday’s (CRM, IBM, MRVL, ORCL) shared zero names.
So the crowd keeps talking about the same big stocks and indices, holds a steady portfolio, and comes up with a new set of strong opinions each morning. Most of these opinions are about names they don’t discuss much or actually own.
That’s not a coordinated group. It’s a stable core of positions with a layer of daily noise on top.
Finding 4: A Fifth Of The ‘Stock Picks’ Aren’t Stocks
Nearly a quarter of what the crowd was discussing wasn’t a company at all.
« Make Full Width »| Category | Entries | Share | Tickers seen |
|---|---|---|---|
| Individual companies | 70 | 78% | MU, MSFT, NVDA, SPCX, IBM… |
| Broad index funds | 14 | 16% | SPY, QQQ, VOO, IWM |
| Commodity fund | 2 | 2% | USO |
| Sector ETF | 1 | 1% | SMH |
| Leveraged ETF | 1 | 1% | KORU (3x South Korea) |
| Crypto | 1 | 1% | BTCUSD |
| Word mistaken for a ticker | 1 | 1% | SAAS |
| Not a company | 20 | 22% |
Finding 5: The Crowd Gets Louder As The Market Falls
Mentions increased along with the SPY ETF. The worst session of the week had the most chatter.
« Make Full Width »| Date | Open | Close | Daily move | SPY volume | SPY mentions |
|---|---|---|---|---|---|
| Mon 13 Jul | $752.47 | $749.17 | −0.77% | 44.01M | 1,482 |
| Tue 14 Jul | $750.91 | $751.83 | +0.36% | 35.14M | 1,375 |
| Wed 15 Jul | $754.24 | $754.81 | +0.40% | 43.84M | 1,340 |
| Thu 16 Jul | $752.76 | $750.72 | −0.54% | 46.41M | 1,757 |
| Fri 17 Jul | $742.08 | $743.29 | −0.99% | 62.65M | 2,052 |
Across the five sessions, the correlation between SPY’s daily return and the volume of SPY chatter is −0.80. Mentions averaged 1,358 on the two up days and 1,764 on the three down days — 30% more noise when the market fell. The week’s worst session, Friday’s −0.99%, produced the loudest board we recorded: 2,052 mentions.
The market’s trading activity followed a similar pattern, but even more closely. SPY turnover went from 44 million shares on Monday to 62.7 million on Friday, a 42% increase, while mentions rose 38%. The two tracked each other with a +0.90 correlation, which is closer than the link between chatter and returns. The crowd talks more when trading picks up, and the busiest trading day was also the loudest and the worst. That shows people joining a sell-off, not starting one.
Five trading sessions is a small sample, so these correlations are only suggestive, not definitive. Still, the pattern held for individual stocks too: Micron’s mentions went up 89%, from 649 to 1,229, while the stock dropped 13.3%.
But the answer to the main question is clear. If WallStreetBets was moving prices, chatter would spike before or during rallies in its favorite stocks. Instead, the loudest days are when prices fall. This crowd is reacting to losses, not causing them.
The IBM Lesson
One call deserves attention on its own, because it demonstrates the lead-versus-lag problem better than any statistic.
On 14 July, IBM fell 25.21% in a single session – its worst day in 115 years – after an earnings miss and a rare CEO letter admitting the company “did not adapt and move quickly enough”. Only then did WallStreetBets erupt: 1,105 comments, 65% bearish, the largest single sentiment sample of the entire week.
The crowd was emphatically right about the direction – the stock fell another 2.70% in the next session, so, under a strict directional score, it counts as a hit. It was also entirely too late. The bearish “call” followed a 25.21% collapse that had already happened, and a call that arrives after the crash is worth nothing to anyone holding the stock. Being “correct” tells you almost nothing.
That’s WallStreetBets in 2026 summed up in one data point: big, confident, and reacting to the news instead of leading it.
2021 Versus Now
Set the GameStop era aside for this trading week, and the change is structural, not cosmetic.
GameStop is now just a relic of sentiment. GME showed up on our sentiment board twice – 82% bullish on Monday (22 comments), then 65% bearish on Friday (23 comments). It never made the top nine most-mentioned. People still have strong feelings about it, but it’s no longer widely discussed, and the crowd’s view changed completely within a week, based on samples of about 20 comments.
A peer-reviewed study in the Review of Financial Studies – “Place Your Bets? The Value of Investment Research on Reddit’s Wallstreetbets” (2024) – found that WallStreetBets due-diligence posts genuinely predicted returns before the squeeze, and that this predictability was eliminated afterward as the forum tilted toward attention-grabbing names and price pressure. And the VanEck Social Sentiment ETF (BUZZ), which holds the most positively discussed large caps, has been far more volatile than the index, without a durable edge – Morningstar rates it neutral.
Looking at the four main ideas about how the forum’s influence has changed, our week supports all of them: it’s smaller and less unique (the loudest ticker is now the index), faster (89% daily churn in sentiment, with new names entering the board from outside the top 40), more tied to the news (IBM, SK Hynix, SpaceX, the memory cycle), and more fractured (talk, opinion, and positions focus on three different sets of names).
The Bottom Line: Does WallStreetBets Still Move Markets?
No – not like it did in 2021.
Every strand of our data points the same way. Its loudest ticker every single day was the S&P 500 itself (SPY ETF), not a squeeze target. It got 30% louder as the market fell, with chatter and returns correlating at −0.80 and chatter and trading volume at +0.90. When IBM collapsed 25%, the crowd turned bearish after the fact.
It added to positions into a falling market all week. A fifth of what it discusses isn’t even a company. Its old mascot draws opinions in 20-odd comments but never reaches the volume leaderboard. And when it did commit to a direction, it was wrong more often than it was right.
This is a crowd reacting to and amplifying a market that’s already moving, not one shaping it. The coordinated force from 2021, which could move a single stock, doesn’t show up in this data.
Based on this week’s evidence, the prediction question answers itself: 41.7% accuracy on the 12 calls we could score – no edge, and maybe even a slight negative one. Twelve calls aren’t enough to settle the question for good; we’d want 60. But even if the crowd were right every time, that wouldn’t change the main point. Predicting a move isn’t the same as causing it.
Five years after GameStop, the crowd hasn’t lost its voice. In fact, it got louder – 2,052 mentions on the week’s worst day, the highest we recorded – even as its influence on prices faded. It has blended back into the market it once briefly changed.
Methodology And Data
Source: The community tracker embedded in the r/wallstreetbets Daily Discussion Thread, captured once per session, 13–17 July 2026. This is a community-run tool, not raw Reddit; its counting and classification methods aren’t publicly documented, and we treat it as one input rather than ground truth. All five captures are treated as end-of-session readings of the tracker.
Sample: 45 mention entries, 45 sentiment entries, 45 holdings entries – 135 leaderboard rows and 2,847 individual bull/bear comment votes.
Prices: Every price and percentage in this article comes from official Investing.com historical data, pulled per ticker. WallStreetBets’ own displayed prices are used nowhere in the results.
Scoring: Outcomes are scored purely on direction – a bullish lean followed by a positive next-day return is correct; a bearish lean followed by a negative return is correct; anything else is incorrect. A minimum of 40 comments applies; index, commodity, cash, crypto, and leveraged funds are excluded from stock-level scoring. We note in the text where a 2% noise threshold would change the result.
Limits: Five sessions is a useful indication, not a definitive verdict. Two-thirds of sentiment readings had fewer than 40 comments, and some ‘strong opinions’ were based on 16 comments. Three calls didn’t have enough time to play out. The −0.80 return correlation and +0.90 volume correlation each rest on five points. The sentiment-accuracy question is unanswered, not answered negatively. The composition and turnover findings are the robust ones because they’re counts rather than returns.
This article is provided for information and journalism – it should not be construed as investment advice.